
Often referred to as a company’s financial snapshot, a balance sheet provides a comprehensive view of an organisation’s financial health at a specific point in time. For businesses, investors, creditors, and other stakeholders, understanding the information contained within a balance sheet is crucial for making informed decisions.
Whether you’re a finance professional or just want to learn more about financial statements, this guide will explore balance sheets from the basics of what they are to why they’re crucial in financial reporting.
What is a Balance Sheet?
A balance sheet, also known as the statement of financial position, is one of the core financial statements. Its primary purpose is to provide a snapshot of a company’s financial position at a specific moment in time, typically at the end of a fiscal quarter or year.
The Purpose of a Balance Sheet
When it comes to financial reporting & analysis, a balance sheet serves a number of different critical functions:
- It provides a clear view of a company’s financial position for stakeholders’ understanding.
- Stakeholders use it to determine a company’s solvency and ability to meet obligations.
- Investors, creditors, and management rely on it for informed decisions.
- It helps companies adhere to reporting regulations and maintain trust.
- It acts as a historical record to track financial performance over time.
- Demonstrates the ownership stake of shareholders in the company.
- A strong balance sheet attracts investors and creditors.
- Enables comparison with industry peers for competitive insights.
- A balance sheet is a vital tool for financial transparency, decision-making, and assessing a company’s financial health.
Key Components of a Balance Sheet:
1. Terms Used
Assets
Assets represent everything a company owns and can include cash, accounts receivable, inventory, property, equipment, and investments.
Liabilities
Liabilities encompass a company’s financial obligations, including loans, accounts payable, and other debts.
Equity
Equity, also known as shareholders’ equity or owner’s equity, represents the residual interest in the company’s assets after deducting liabilities. It reflects the ownership interest of shareholders in the company.
2. The Structure
A balance sheet typically follows a structured format to ensure clarity and consistency. To read it effectively, you need to familiarise yourself with this structure.
Assets
Assets are listed on the left side of the balance sheet. They are generally categorised in order of liquidity, with the most liquid assets (like cash and accounts receivable) listed first, followed by less liquid assets (like property and equipment).
Liabilities and Equity
On the right side, you’ll find liabilities and equity. Liabilities are often divided into current liabilities (short-term obligations) and long-term liabilities (obligations with longer maturities). Equity represents the ownership interest in the company, including common stock, retained earnings, and additional paid-in capital.
Total Assets Equals Total Liabilities and Equity
Remember that the balance sheet always adheres to the fundamental accounting equation: Assets = Liabilities + Equity. This equation ensures that the balance sheet remains balanced, with the total value of assets equaling the total value of liabilities and equity.
3. Analysing Specific Items
To read a balance sheet effectively, you should be able to analyse specific items within each category in depth:
Assets: Analyse the breakdown of current assets, such as cash, accounts receivable, and inventory. Examine non-current assets, like property, plant, and equipment, to assess their book values and depreciation.
Liabilities: Examine the types of liabilities, including short-term and long-term debt. Pay attention to the nature of obligations, interest rates, and maturity dates. Analysing the liability section can reveal insights into a company’s financial obligations and its ability to meet them.
Equity: Study the components of equity, including common stock, retained earnings, and other comprehensive income. Changes in equity over time can provide insights into the company’s profitability and shareholder value.
4. Ratios and Analysis
One of the primary purposes of reading a balance sheet is to derive meaningful financial ratios and perform financial analysis. Some key ratios that can be calculated using data from the balance sheet include:
Current Ratio: Calculated as Current Assets / Current Liabilities, this ratio measures a company’s short-term liquidity and its ability to meet short-term obligations.
Debt-to-Equity Ratio: This ratio, calculated as Total Debt / Total Equity, assesses a company’s leverage and financial risk.
Return on Equity (ROE): ROE is calculated as Net Income / Shareholder’s Equity, providing insights into a company’s profitability relative to its equity base.
How To Read a Balance Sheet
To understand how to read a balance sheet, the easiest thing to do is to look at an example.
Example
Let’s look at a real-world example, using Qantas’ 2021-22 publicly available financial statement.
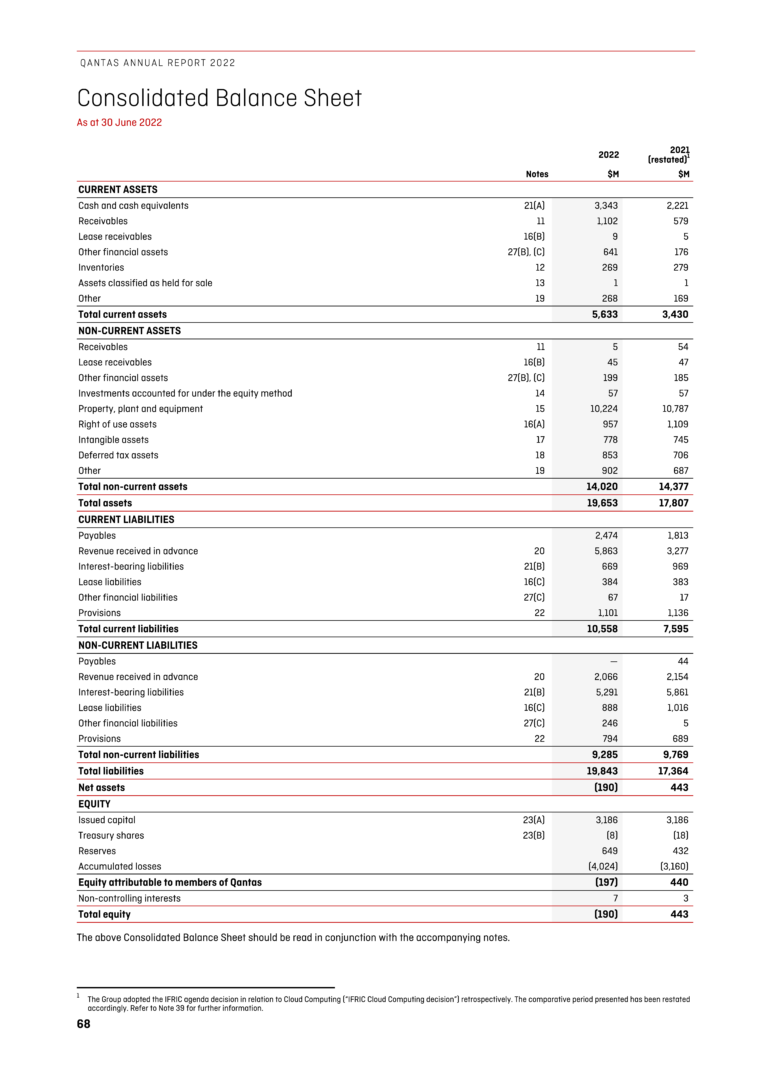
The Numbers
On this balance sheet (page 68) we can see:
- Current assets increased from $3,430M in 2021 to $5,633M in 2022. This includes a rise in cash and equivalents from $2,221M to $3,343M and a significant increase in receivables from $579M to $1,102M.
- Non-current assets decreased slightly from $14,377M in 2021 to $14,020M in 2022. Property, plant, and equipment decreased from $10,787M to $10,224M.
- Current liabilities rose from $7,595M in 2021 to $10,558M in 2022, with revenue received in advance increasing from $3,277M to $5,863M. Non-current liabilities decreased marginally from $9,769M to $9,285M.
- The total equity fell from $443M in 2021 to -$190M in 2022, primarily due to a rise in accumulated losses from $3,160M to $4,024M.
These numbers indicate a significant increase in liquidity and operational activity, but also a concerning increase in short-term financial obligations and a notable decrease in the overall equity, driven largely by accumulated losses. This could suggest potential financial stress or strategic shifts in the company’s operations.
The Ratios
Based on these numbers, let’s look at some of the ratios we can calculate:
Current Ratio = Current Assets/Current Liabilities = 5633/10558 = 0.53 A current ratio of less than 1 indicates that the company may have difficulties meeting short-term obligations.
Debt-to-Equity Ratio = Total Liabilities/Total Equity = 19843/(-190) = -104.44. This ratio is not standard due to the negative equity, which is an unusual situation and suggests financial distress or significant accumulated losses.
Return on Equity (ROE) measures a company’s profitability relative to the equity. Unfortunately, the calculation of ROE requires the Net Income figure, which was not provided in the balance sheet. Therefore, ROE cannot be calculated with the available data.
These ratios, particularly the negative debt-to-equity ratio, highlight significant financial challenges for Qantas during this period, which is unsurprising due to the COVID-19 pandemic and associated reductions in flights and travel during this time.
Unlock the Power of Balance Sheets with Allen Audit & Advisory
At Allen Audit & Advisory, we turn balance sheets into tools for better business decisions. Our financial reviews give you clear, actionable steps to improve areas like debt collection and stock management. We ensure your financial reporting is accurate, compliant, and useful for making informed choices. Contact us today to strengthen your business’s financial performance and strategy.